As Austin’s housing market freezes, sellers are facing a new reality: less money for their homes
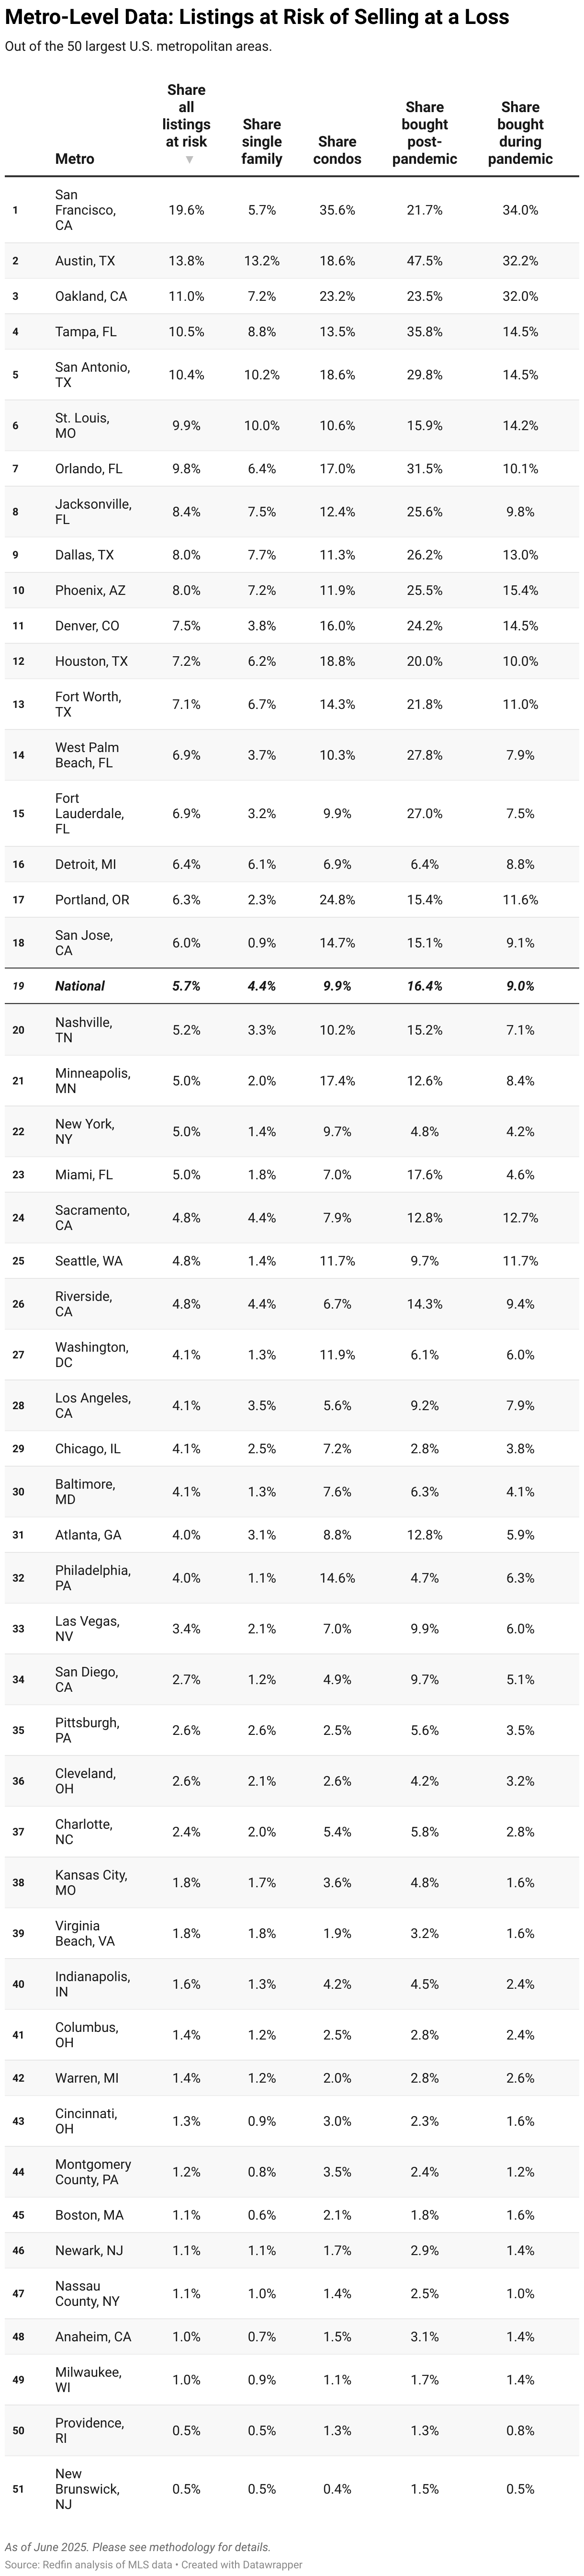
In Austin, 14% of all listings are at risk of selling for less than homeowners bought them for. This is double the 6% share last year and the second highest among the top 50 metros. Nationally, 6% of sellers are at risk of losing money on a sale.
However, the share varies widely depending on when someone bought their home, with those buying more recently tending to be more at risk.
- 48% of sellers who bought post-pandemic are at risk of losing money on the sale – by far the highest share in the nation. The nationwide share is 16%.
- 32% of sellers who bought during the pandemic are at risk of losing money on the sale. Nationally, this share is 9%.
- 0.5% of sellers who bought pre-pandemic are at risk of losing money on the sale, well below the 2% in danger across the country.
Austin’s housing market skews heavily in favor of buyers, as prices fall and inventory rises. The metro’s dramatic pandemic-era price swings means sellers who bought at the peak face the greatest risk of losing money on the sale – home values surged from 2020-2022, but have dropped sharply in the years that followed.
That’s not to say Austin home sellers will actually come out behind. Typically, sellers facing a financial loss will wait until they find a buyer willing to pay the asking price, take their home off the market, or rent it out. Plus, the vast majority of sellers still make money on their home sale: Nationwide, 94% of homes sell for more than they were purchased for, compared to just 37% in 2012.
How has Austin’s housing market changed since the pandemic?
Austin is the poster child of pandemic boomtowns: It was one of the hottest cities in the nation from 2020-2022, luring people with its hip culture, affordable prices, and low tax rates. By April 2022, this popularity had propped up prices by 71%.
But later that year, prices had already started dropping – and they haven’t stopped falling since. Priced-out residents and the rise of AI in coastal tech hubs prompted companies and workers to leave the trendy Texas metro and return to the coasts.
Today, the Austin housing market is experiencing one of the largest price corrections in the nation, exacerbated by climate risks and insurance price hikes. This means that homeowners who bought at the peak are at the highest risk of selling at a loss.
Falling prices would create a larger gap
If prices fall in line with Redfin forecasts by the end of the year, more sellers would be susceptible to losing money on their home. Even the least-affected metros – New Brunswick, NJ, and Providence, RI – would see notable increases.
- If prices drop by the predicted 1%, 15% of Austin listings would be at risk.
- If prices drop by 3%, 17% would be at risk.
- If prices drop 5%, 19% would be at risk.
Those who bought prior to the pandemic face the lowest risks of selling at a loss, but they’re also less likely to move in the first place thanks to their lower mortgage rates.
How buyers and sellers can navigate the Austin market
Austin’s housing market has shifted significantly since the pandemic, creating more opportunities for buyers and more pressure for sellers.
- Buyers: With elevated housing costs and more homes on the market, buyers in the market are generally in command in Austin. They should come prepared to negotiate and move quickly when the right home comes along.
- Sellers: Sellers generally don’t have the negotiating power they had during the pandemic, so they may need to offer incentives to attract what buyers remain.
Complete metro-level data
Methodology
Based on a Redfin report, which analyzed active listings on the MLS in May for the 50 largest U.S. metros. All housing data is from Redfin.
The report identifies the share of sellers at risk of selling at a loss, not the share of sellers who will actually sell their home at a loss, and does not take closing costs into account. We defined the pandemic as July 2020-July 2022, when home prices rose the most. Please see the original report’s methodology for complete details.
Source link